I was just going to include this in Monday’s state-of-play voting fraud roundup, but since I found out that Facebook is blocking access to one of the source articles, literally preventing you from posting a link to it (I tested), saying that it “this link goes against our community standards.” So I decided to do this post to let you have something you can share on Facebook.
The first link I saw on the topic was this GitHub piece forwarded to me by reader Brandon Byers, who noted “the Wikipedia entry for Benford’s Law was edited 11/5 in order to downplay its usefulness in detecting election fraud.” It appears that a lengthy edit war is still going on there. The author is one “cjph8914”; no idea who it is; GtHub is a code repository system that anyone can sign up for and use.
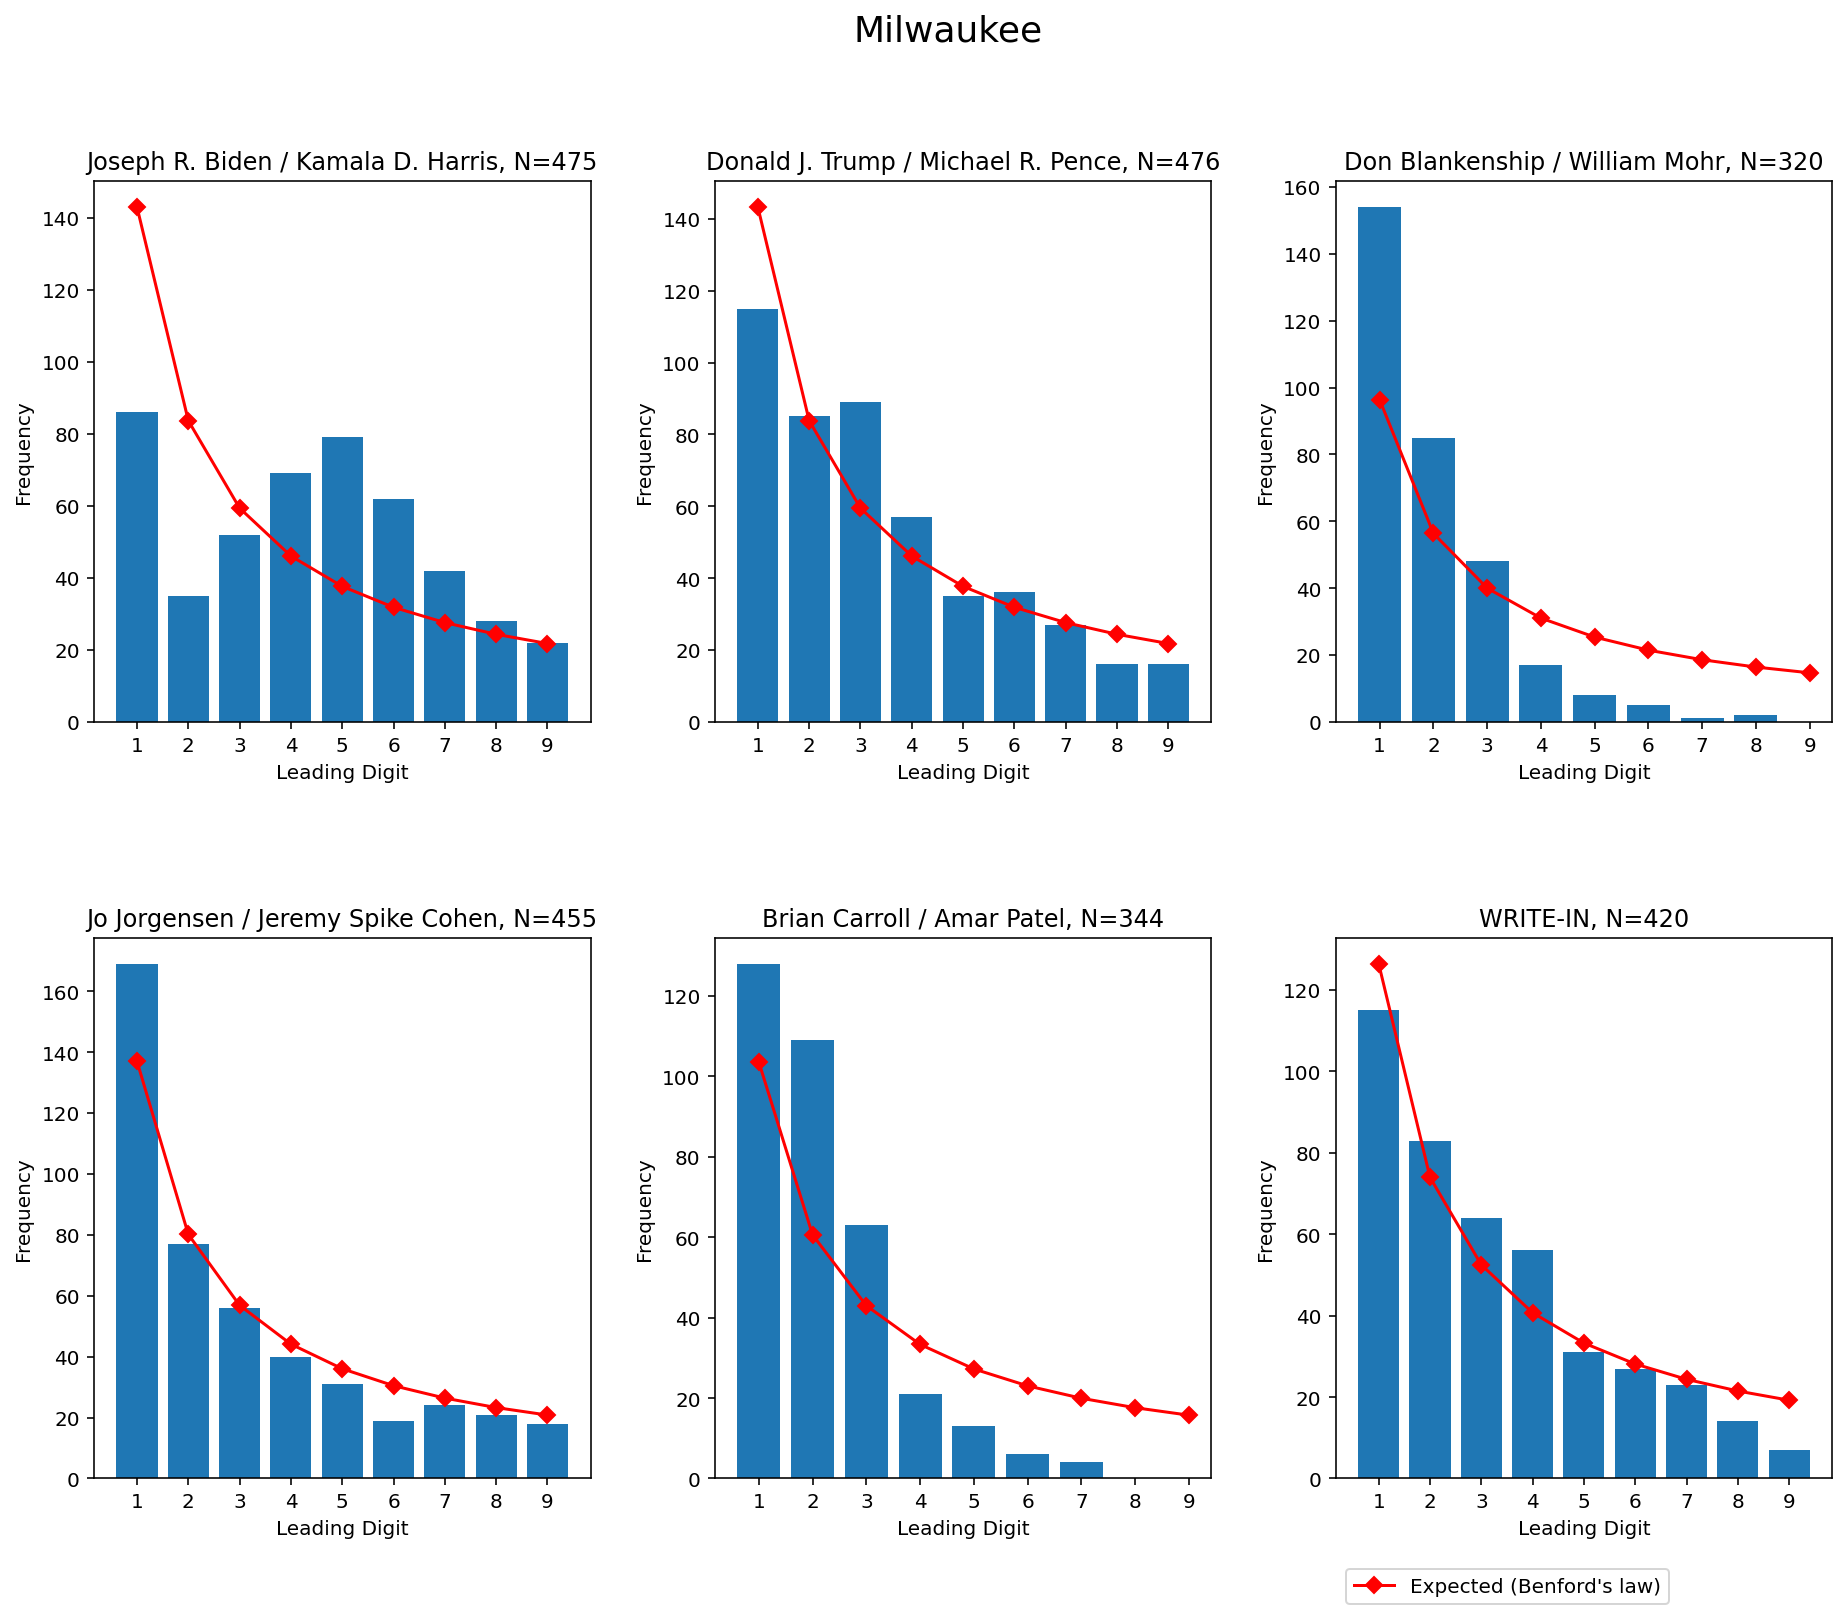
Benford’s Law, also called the Newcomb–Benford law, the law of anomalous numbers, or the first-digit law, is an observation about the frequency distribution of leading digits in many real-life sets of numerical data. The law states that in many naturally occurring collections of numbers, the leading digit is likely to be small. For example, in sets that obey the law, the number 1 appears as the leading significant digit about 30% of the time, while 9 appears as the leading significant digit less than 5% of the time. If the digits were distributed uniformly, they would each occur about 11.1% of the time. Benford’s law also makes predictions about the distribution of second digits, third digits, digit combinations, and so on.
This GNews piece by “Himalaya Australia” makes much the same argument, and is the one that Facebook is blocking: “As the vote counting for the 2020 Presidential Election continues, various facts suggest rampant frauds in Joe Biden’s votes. So does mathematics in terms of the votes from precincts.”
Wikipedia description snipped.
However, in the Milwaukee County of Wisconsin, which is in one of the key swing states, Joe Biden’s votes violate Benford’s Law while other candidates’ don’t. (Joe Biden 69.4%, Donald Trump 29.4%, Jo Jorgensen 0.9%. Source: theguardian.com)
Here’s a YouTube video that explains the basic concepts of Benford’s Law:
Here’s a YouTube video that basically covers the GitHub piece, which covers other urban areas where it appears Biden’s vote total violates Benford’s Law:
I am not a statistician or a mathematician, but this does seem to make a good case for pro-Biden vote fraud in some urban areas.
Try posting this to Facebook. I wonder how many hits I’ll have to get before someone there tries to block it…
Tags: 2020 Presidential Race, Benford's Law, Democrats, Elections, Facebook, GitHub, Joe Biden, Milwaukee, statistics, video, Wisconsin
[…] Attacking so fast they won't know what hit them… « Benford’s Law Shows Biden Vote Fraud […]
What is the data set? I am guessing it is number of votes in each county for WI IL and MI, is that right?
I saw a similar analysis from 2016 and it followed Benford’s Law.
Very interesting.
The datasets he relied on can be found here.
Don’t get too excited about this. Benfords works when the *expected* data is exponential, with samples spanning multiple orders of magnitude (powers of 10). Election districts in the US tend to be similar sizes for equal representation within the state, so Benfords doesn’t apply. Click the “issues” tracker at the github site for the disappointing details.
Sorry. The proof you want may be out there. Just not here.
Anon Amos then one would have to explain how this anamoly *didn’t* happen in Wisconsin in the 2016 election. https://www.purdue.edu/discoverypark/ppri/docs/Wisconsin.pdf
Thank you Nick for pointing that out. The 2016 Wisconsin pdf appears to use counties instead of districts. Counties don’t artificially constrain the population size like districts do, so they would likely have the right sort of data distribution for Benfords to work. Unfortunately the link to the 2016 data has expired. But if you can get county data for this election you may have something. Good luck!
Oh wait. The problem with counties is if all the fraud happens in 1 or 2 counties with major cities then it’s only 1 or 2 of the first digits that are wrong, and that’s not enough to bend the Benford curve. Perhaps that’s why counties were selected in 2016 because it will show a nice Benford curve, but will not show fraud unless it’s in multiple counties. Ask yourself which side produced that pdf, and what was their motivation.
[…] for Benford's Law is being hastily rewritten to cover this up. If you can't see the original link, here's another.Trump won 9/10 bellwether counties.Comparing R/D votes over time shows some oddities, as does […]
Yes, sources on Benford’s law are being rewritten as we speak, and most likely with malicious intent. But the truth remains that it’s difficult to apply it to election results. However, results like those from 2016 Wisconsin county data tell you that any sort of massive fraud is not widespread geographically. If it exists then it must be concentrated in very few counties so as not to bend the curve. So look at the at the counties with the largest population centers. That’s the place where the massive fraud can be hidden. But at that point you need to use a different tool. The district sized data is not the right sort for Benford analysis.